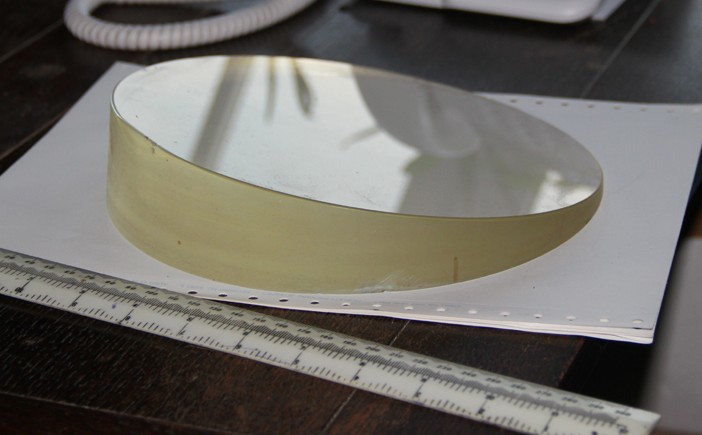
 Fig. 1. The BAA objective prism.
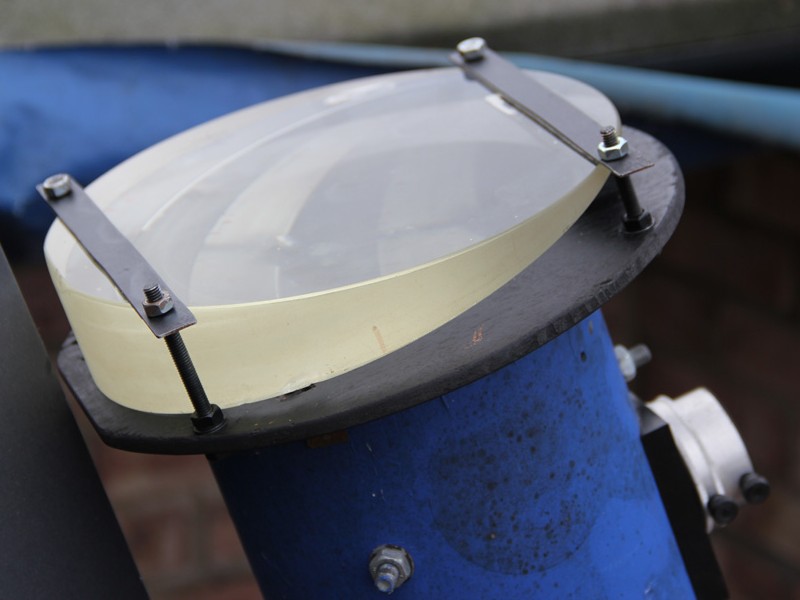 Fig. 2. The BAA objective prism mounted on the 11 cm refractor.
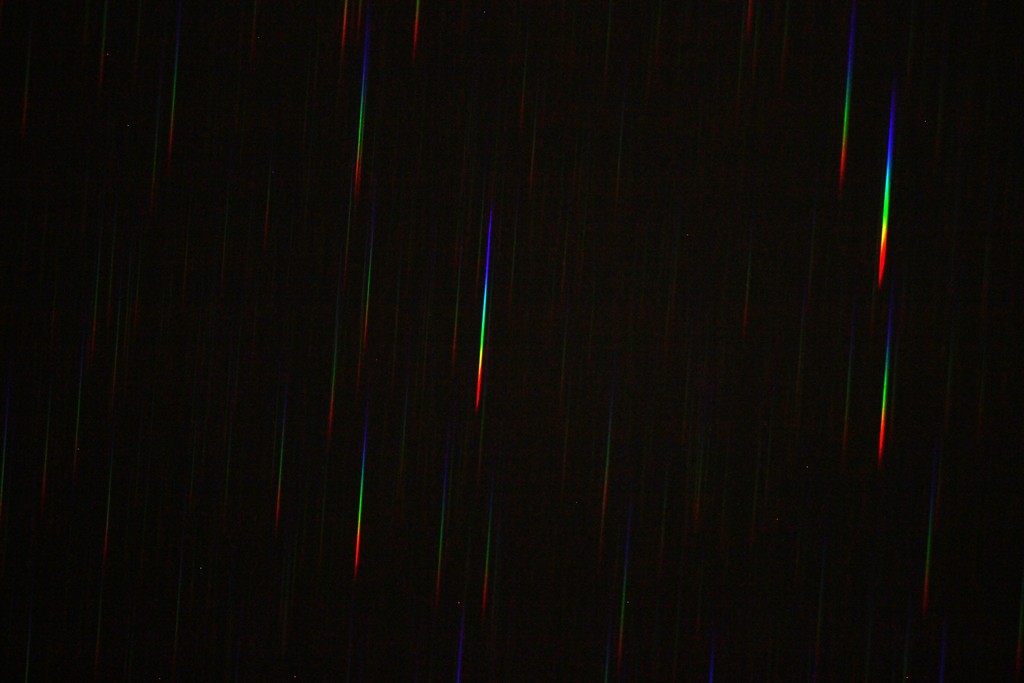 Fig. 3. Spectra produced by objective prism. (09 Jan 2013.)
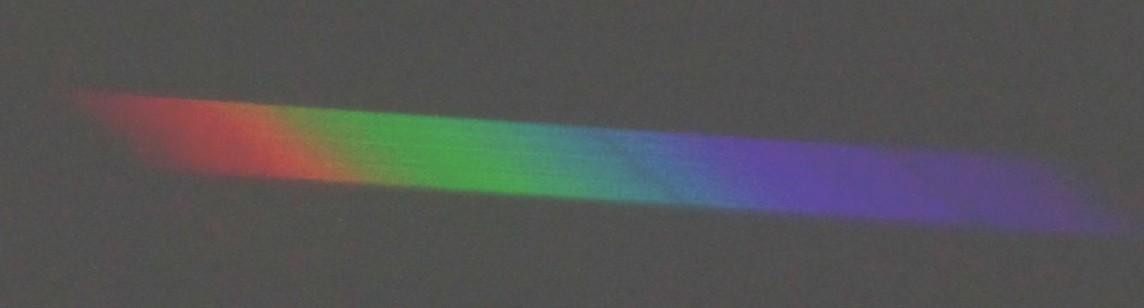 Fig. 4. Single spectrum showing Hβ and Hγ lines. (09 Jan 2013.)
Orwell Astronomical Society (Ipswich)
Spectroscopic Observations, 09 January - 13 November 2013
In early 2013, two members of OASI began experimenting with spectroscopy, using very different techniques.
During 2012, I arranged with Bob Marriott, director of the BAA Instruments and Imaging section, to borrow an objective prism. In late 2012 Bob visited Ipswich and delivered the prism. As you can see from figure 1 below, it's a chunky piece of glass, 21 cm in diameter, 50 mm thick on one side and just a few mm on the other, presenting an angle of approximately 12°. It has a mount to facilitate attachment to a telescope and I’m keen to try it on the Tomline Refractor, although the precise method of attachment that will be required is not obvious at present!
I obtained my first spectra with the prism on 09 January 2013. I used my 11 cm F/5 Newtonian standing on end pointing to the zenith with the prism resting over the top of the tube (figure 2). The telescope was unguided to allow the stars to trail and form wide spectra. (The field of view is about 2.3x1.5°.) I used a Canon 550 DSLR to record the spectra. It proved difficult to focus the optical system, and I don’t know at this stage from which stars I captured spectra (!) but the system clearly has potential. The spectra are about 5 mm long, i.e. ~1/100th the focal length of the telescope. So on the Tomline Refractor, I would expect to produce spectra about 40 mm long; this is much bigger than the DSLR sensor but does promise good resolution for bright stars. Two spectra are shown below (figures 3 and 4). Hβ and Hγ lines may be seen in blue light in the single spectrum. However, the DSLR has a standard sensor/filter combination and doesn’t record red strongly and so the Hα line is not visible.
Two days later, I re-mounted the 11 cm refractor on my main instrument, enabling it to be directed at known stars. I attached the prism with the wedge pointing north and used the instrument without tracking to allow the resulting spectra to trail to aid visibility of spectral lines. I recorded spectra this way of four well-known bright stars of the winter constellations, Castor, Pollux, Betelgeuse and Capella. The spectra are shown in figure 5 side by side to illustrate similarities and differences. Recall the spectral sequence of stars, OBAFGKM, spanning from the hottest, blue class O to the coolest, red class M. Castor is a class A star and clearly shows the three main hydrogen lines, Hα in the far red and Hβ and Hγ in the blue. Pollux, class K0, and Capella, G8, are very close in spectral classification. Betelgeuse, class M2, is quite different being at the opposite end of the spectral sequence.
It’s early days yet with the objective prism, but getting such interesting results with modest equipment is very encouraging. There are many areas of investigation to pursue. It’s already clear that there are many factors involved in obtaining spectra. Collimation and focus are just as important as in imaging. The type of detector used determines how much of the spectrum is seen. The unmodified Canon 550 DSLR cuts off just beyond Hα in the red: it will be interesting to compare with a CCD having a better red response. Spectra through the Tomline refractor should have approximately six times the resolution of those discussed here, and will be larger than CCD or even DSLR chips; this will necessitate stitching together several images of part-spectra.
Some spectra taken in late summer 2013 are shown in the OASI observations of Nova Delphini (V339 Del). There are also two later examples below:
Fig. 1. The BAA objective prism.
Fig. 2. The BAA objective prism mounted on the 11 cm refractor.
Fig. 3. Spectra produced by objective prism. (09 Jan 2013.)
Fig. 4. Single spectrum showing Hβ and Hγ lines. (09 Jan 2013.)
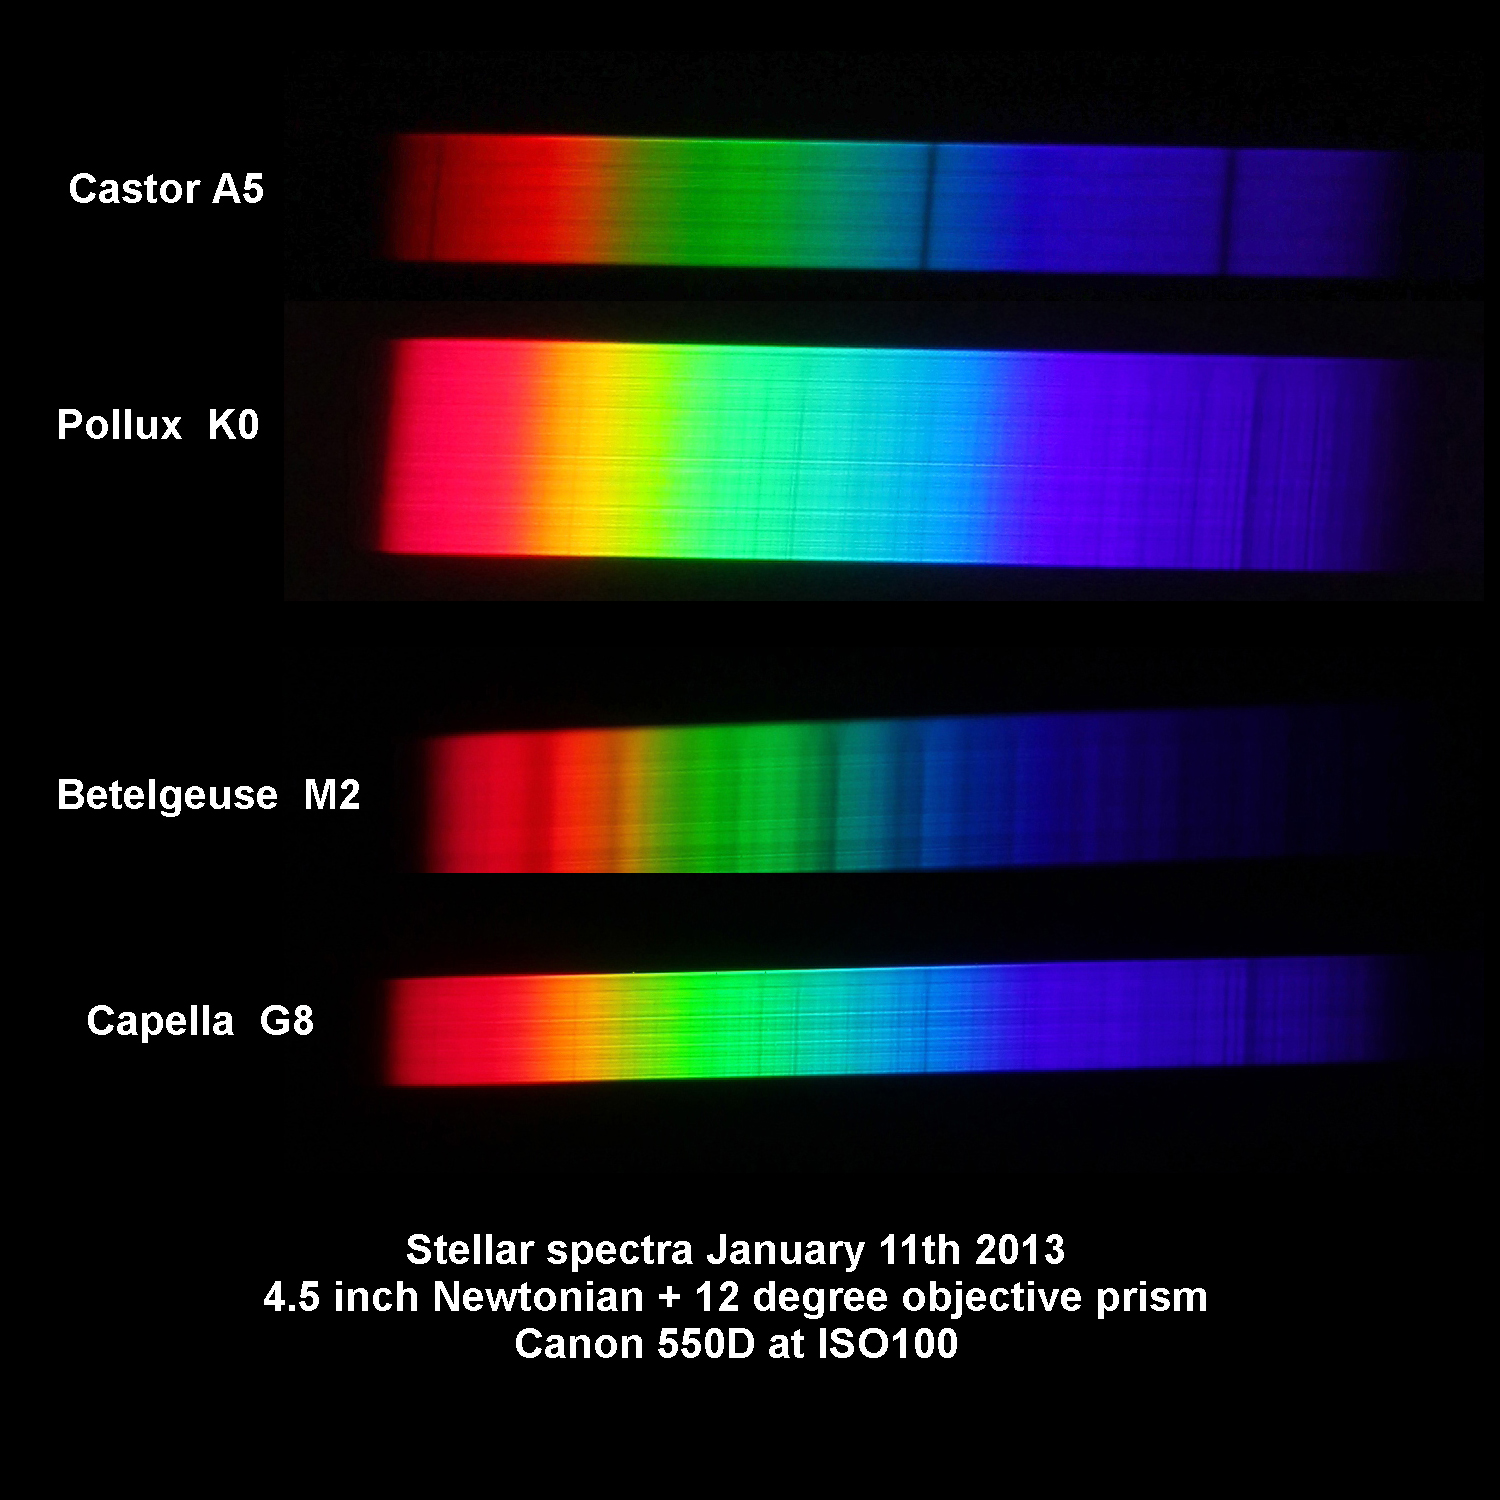 Fig. 5. Spectra of Castor, Pollux, Betelgeuse and Capella. (11 Jan 2013.)
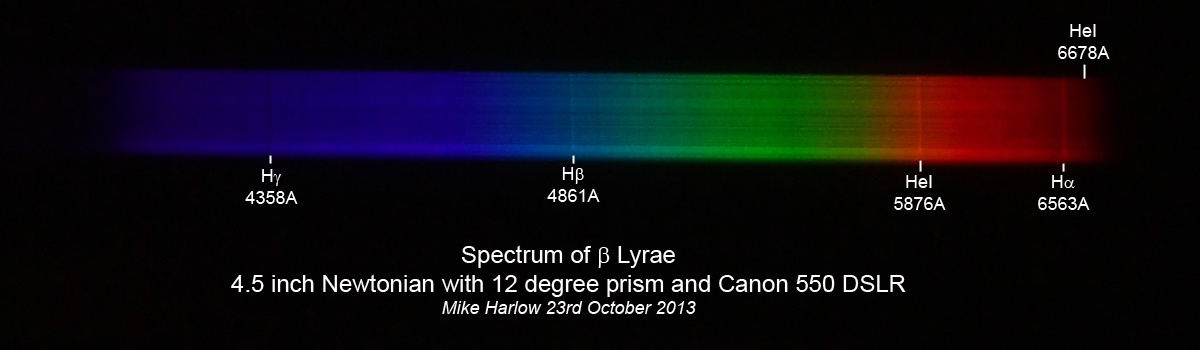 Fig. 6. Spectrum of β Lyrae. (23 Oct 2013.)
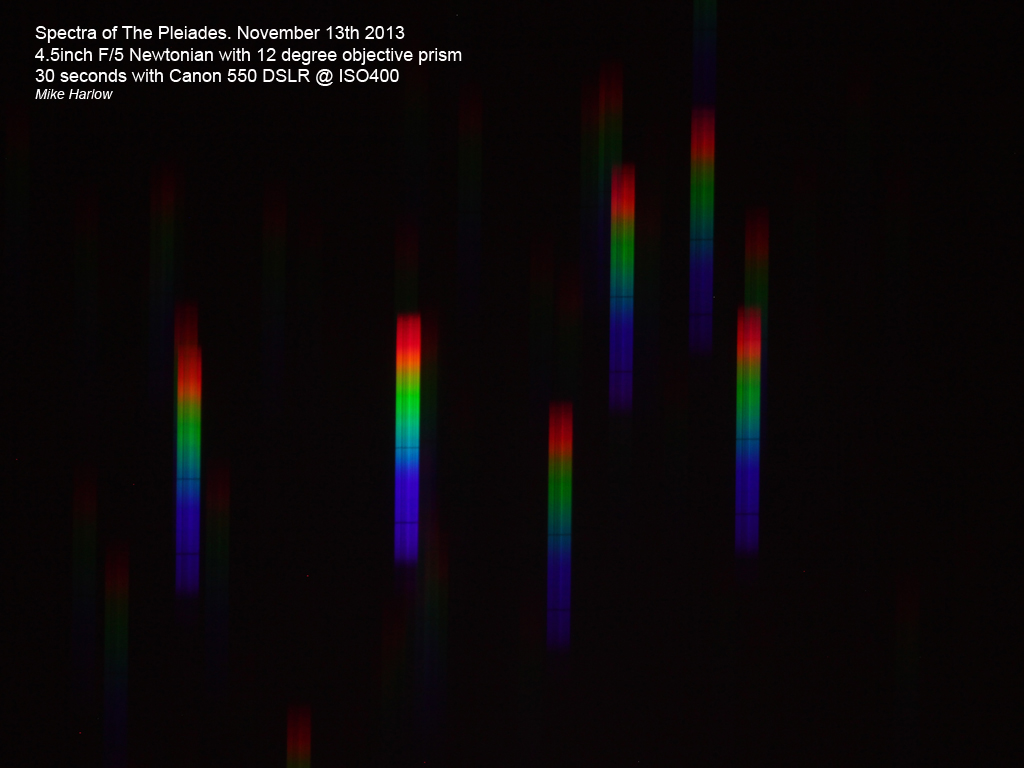 Fig. 7. Spectra of the Pleiades. (13 Nov 2013.)
Diagonally opposite one another in Orion, Betelgeuse and Rigel are very different in their nature and spectral characteristics. Betelgeuse is a red supergiant with a low surface temperature (3500 K) and hence red appearance (both visually and spectrally), while Rigel, a triple star, has a much higher temperature (12,000 K) and hence an enhanced blue end of the spectrum. Betelgeuse is spectral class M2 and Rigel class B8.
The following image illustrates the differences in spectra of the two stars. I obtained the spectra at 20:30 UT on 27 January 2013 from my home in Felixstowe, using a 120 mm, f7.5 refractor with a 100 lines/mm Star Analyser diffraction grating placed 50 mm in front of the sensor of a Philips SPC900NC webcam.
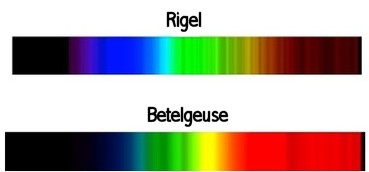
The images above appear to show significant differences between the two techniques. The grating has an almost linear response to wavelength whereas the prism has much higher dispersion in the blue than in the red. The result is that the blue end of the prism spectrum is much longer than the red end whereas the spectrum produced by the diffraction grating is more uniform. There is also an effect due to the greater spectral range of the webcam compared to the DSLR; the latter cuts off above about 670 nm.
There is a suspicion that bands produced by atmospheric oxygen may be visible in the far red end of diffraction grating spectrum of Rigel. At the present time, this remains a topic for further investigation.
Mike Harlow, Mike O'Mahony